
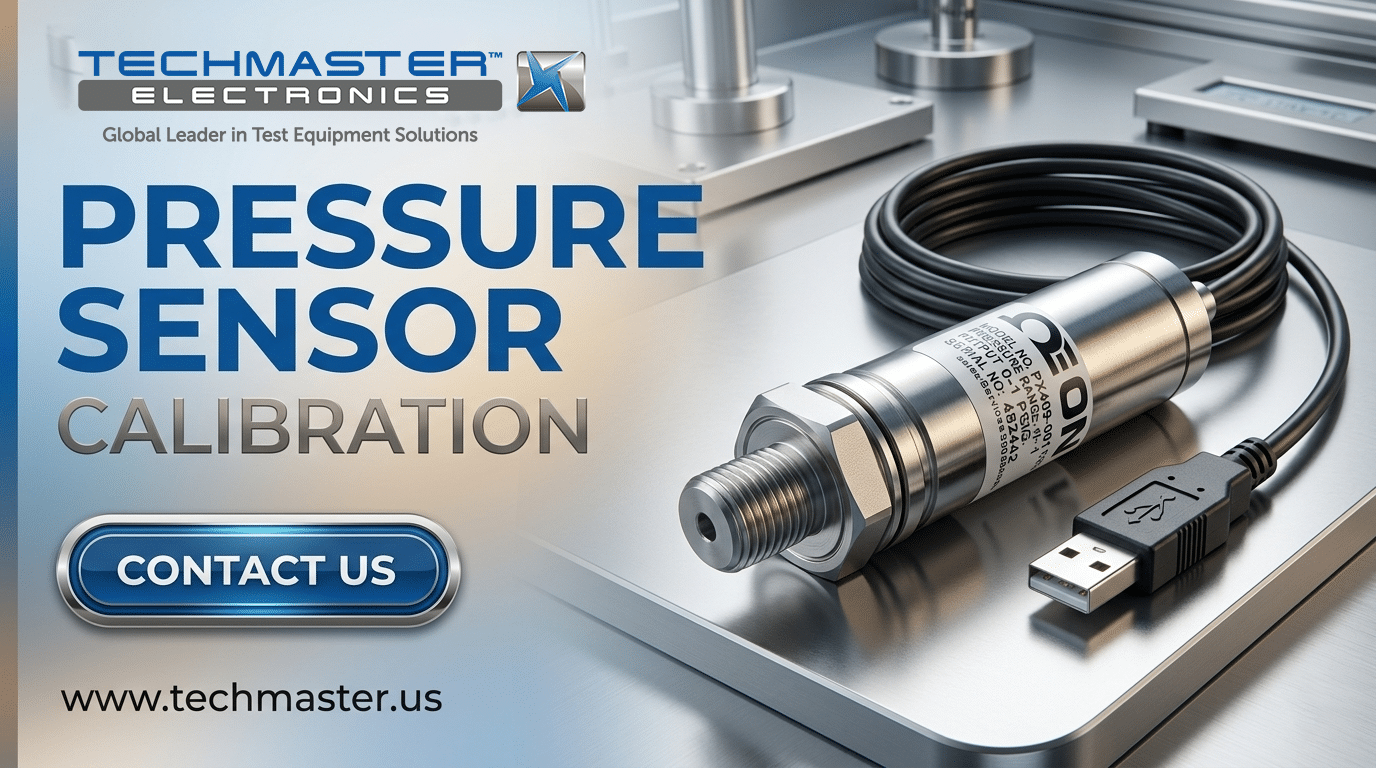
Pressure Sensor Calibration
Why calibration intervals matter
How Pressure Sensor calibration works
- Intake & visual inspection
- Environmental stabilization
- As-found measurement
- Comparison to NIST-traceable standards
- Adjustment if required
- As-left results & certificate
Your calibration, covered
In-lab vs on-site calibration
In-lab calibration
- Accredited bench with full reference standards
- Best achievable measurement uncertainties
- Pickup & return logistics handled
- Ideal for precision and reference work
On-site calibration
- We calibrate the Pressure Sensor at your facility
- No shipping risk or transit downtime
- As-found data captured before any move
- Ideal for fixed, large or sensitive assets
In-depth guide
1. WHEN A 0.5% ERROR LEADS TO BILLIONS IN LOSSES
In a real-world industrial scenario, a semiconductor manufacturing plant encountered a severe crisis when the central compressed air system reported a stable pressure of 7.0 bar, while the actual pressure at the spray nozzles had secretly dropped to 6.2 bar; this undetected deviation caused a 15% spike in product defects during a single shift, leading to massive material waste and questioning the facility’s equipment management integrity ahead of an ISO audit. Using high-end Pressure Transmitters like the Rosemount 3051 or Yokogawa EJA without a rigorous Pressure sensor calibration schedule is essentially a financial “time bomb,” as professional Pressure transducer calibration is not just about issuing a certificate—it is the strategic process of verifying accuracy, calculating Measurement Uncertainty, and optimizing device performance to ensure every data point on your SCADA system reflects the absolute truth.
2. EQUIPMENT ENTITIES & HARSH OPERATIONAL CONTEXTS
In industrial environments, Pressure Sensors and Transmitters face invisible adversaries that degrade performance over time:- Mechanical Vibration: Often found in sensors mounted near pumps or compressors, leading to loosened internal mechanical connections.
- Pressure Spikes: Sudden valve operations create shockwaves that exceed the Full Scale (FS), causing permanent deformation of the sensing diaphragm.
- Ambient Temperature Shifts: Thermal expansion of the silicon oil within the sensor cavity leads to the “Zero Drift” phenomenon.
Understanding the behavior of popular models such as the Rosemount 3051, Endress+Hauser Cerabar, or Emerson 2088 series allows technicians to predict specific error characteristics based on their diaphragm technology (Capacitive vs. Piezoresistive), making regular Pressure sensor calibration an indispensable part of predictive maintenance. Furthermore, specialized Pressure transducer calibration ensures that the core conversion element remains stable under these varying environmental stresses.
3. ISO/IEC 17025 CALIBRATION WORKFLOW
Pressure calibration requires absolute rigor regarding master standards and environmental conditions. We follow the EURAMET cg-17 guidelines to ensure objectivity and international acceptance.1. Preparation of Master Standards
To calibrate a sensor with 0.1% FS accuracy, the standard must be at least 4 times more accurate (Test Uncertainty Ratio – TUR 4:1).- Deadweight Tester (DWT): Used for high-precision laboratory measurements by balancing pressure against certified mass sets.
- Digital Pressure Calibrator: Ideal for on-site inspections, offering portability and automated data logging.
2. Step-by-Step Execution
- Visual Inspection: Ensure connection threads are intact and the diaphragm is free from chemical buildup or corrosion.
- Warm-up: Power the transmitter for at least 15-30 minutes to stabilize electronic components thermally.
- Zero Adjustment: Calibrate at atmospheric pressure to establish a baseline.
- Measurement Cycles (Up/Down):
- Increase pressure at points: 0%, 25%, 50%, 75%, 100% of the range.
- Decrease pressure back through: 100%, 75%, 50%, 25%, 0%.
- Purpose: To determine Hysteresis and Repeatability.
3. Measurement Uncertainty Analysis
An ISO 17025 compliant report must calculate the following components:- Standard Uncertainty: The measurement uncertainty associated with the reference standard (Master Standard).
- Device Resolution: The smallest detectable change in the display of the Device Under Test (DUT).
- Repeatability Deviation: The variation in measurements obtained when the same point is measured multiple times under identical conditions.
- Mechanical Hysteresis: Errors caused by the physical lag or “memory” of the sensor’s diaphragm during pressure cycles.
4. THE “TECHNICIAN’S EYE” – FIELD DISCOVERIES BEYOND TEXTBOOKS
Field Discovery: During a calibration at a chemical processing plant, we noticed several high-end transmitters reporting significant errors immediately after being “calibrated.” Hidden Root Cause: Operators had installed the sensors at locations prone to “air pockets” in liquid lines. The trapped air acted as a compressible cushion, slowing down the Response Time and creating “phantom errors” during rapid pressure transitions.Expert Advice: Always perform thorough bleeding at the manifold valves before Pressure sensor calibration or professional Pressure transducer calibration to ensure no air is trapped in the impulse lines before returning a device to service.
5. TECHNICAL COMPARISON & SIMULATED FIELD DEVIATION DATA
Theoretical vs. Observed Field Deviations
High-end models like the Rosemount 3051 or Yokogawa EJA are robust, but they degrade in harsh environments. Mechanical vibration, pressure spikes, and ambient temperature shifts lead to cumulative errors that outpace theoretical tolerances.
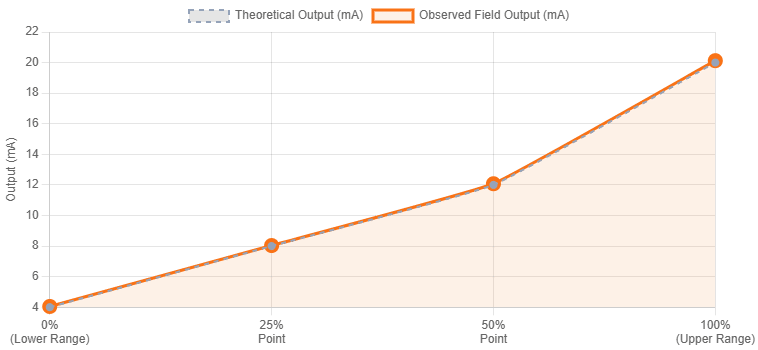
| Test Point (0-10 Bar) | Standard Value (bar) | Theoretical Output (mA) | Tolerance (±) | Observed Field Output (Simulated) | Field Analysis & Root Cause |
|---|---|---|---|---|---|
| 0% (Lower Range) | 0.000 | 4.000 mA | 0.016 mA | 4.048 mA | Zero Drift: Thermal buildup or mounting stress. |
| 25% Point | 2.500 | 8.000 mA | 0.020 mA | 8.032 mA | Linearity Error: Early signs of mechanical aging. |
| 50% Point | 5.000 | 12.000 mA | 0.025 mA | 12.075 mA | Span Drift: Cumulative error; output rising faster than input. |
| 100% (Upper Range) | 10.000 | 20.000 mA | 0.016 mA | 20.124 mA | Over-range Stress: Result of frequent near-threshold operation. |
| Hysteresis | – | < 0.05% FS | 0.005 bar | 0.018 bar | Membrane Fatigue: High deviation between cycles; imminent failure. |
6. CORE TECHNICAL DEFINITIONS
METROLOGICAL TRACEABILITY: The property of a measurement result whereby the result can be related to a reference through a documented unbroken chain of calibrations, each contributing to the measurement uncertainty (e.g., traceable to NIST).
HYSTERESIS: The maximum difference between the output readings for the same input value, depending on whether that value was reached by increasing or decreasing the pressure.
7. REGULATORY COMPLIANCE AND RISK MITIGATION STRATEGY
Beyond technical accuracy, maintaining a rigorous calibration schedule is a cornerstone of corporate risk management. In high-stakes industries such as oil and gas, pharmaceuticals, or aerospace, the traceability of Pressure sensor calibration data directly impacts a company’s ability to retain certifications like ISO 9001, AS9100, or IATF 16949. During third-party audits, the absence of valid, accredited calibration certificates for critical Pressure Transducer calibration points can trigger “Major Non-Conformance” findings. This not only jeopardizes operating licenses but also increases insurance premiums and liability exposure in the event of an industrial accident. Furthermore, a well-documented calibration history provides the empirical evidence needed for “Condition-Based Maintenance” (CBM). Instead of replacing expensive sensors on a fixed schedule, engineers can analyze drift trends to predict the end-of-life for a specific unit. This data-driven approach transforms calibration from a periodic expense into a strategic asset, optimizing maintenance budgets while simultaneously enhancing plant-wide safety. By partnering with an ISO/IEC 17025 accredited laboratory, you ensure that every data point stands up to the most intense international scrutiny, effectively future-proofing your operations against evolving regulatory demands.8. FREQUENTLY ASKED QUESTIONS (FAQ)
1. Why does my pressure sensor keep drifting at the Zero point? Zero drift is typically caused by extreme ambient temperature fluctuations or mechanical stress during installation (over-torquing). Ensure proper torque specs and use a siphon tube for hot steam applications. 2. What is the recommended calibration frequency? Standard practice is every 12 months. However, for environments with high vibration or corrosive media, we recommend a 6-month interval to prevent catastrophic failure. 3. Can I calibrate using a hand pump and a digital gauge? You can perform a “check,” but for legal compliance and ISO safety audits, you require a lab with ISO/IEC 17025 accreditation to ensure objective data and calculated Uncertainty values. 4. What is the difference between a Transducer and a Transmitter? A Transducer converts pressure into a raw electrical signal (like mV); a Transmitter conditions that signal into a standard industrial output (like 4-20mA or HART) for long-distance transmission. 5. How do I verify a calibration certificate’s international validity? Look for the accreditation mark (e.g., ILAC-MRA). This confirms the laboratory has passed rigorous peer-reviewed competency assessments.9. CONCLUSION & STRATEGIC ACTION
Don’t let a minor deviation in your pressure transmitter become a major hole in your budget. Calibration is more than compliance; it is profit optimization. Expert Takeaways:- Always inspect impulse lines before suspecting a sensor fault.
- Demand “As-found” (before adjustment) and “As-left” (after adjustment) data from your service provider.
Ready to Optimize Your System?
Don’t let small errors cause big losses. Let our experts help you maintain absolute accuracy.
Schedule Calibration TodayFrequently asked questions
What is Pressure Sensor Calibration?
How often should a Pressure Sensor be calibrated?
What standards apply to Pressure Sensor Calibration?
What is included on the certificate?
Can you calibrate the Pressure Sensor on-site?
Need Pressure Sensor calibration?
ANAB-accredited, NIST-traceable, fast turnaround — in-lab or on-site across the USA.
Contact us for a quote