
What is Allan deviation, and why isn’t a frequency calibration enough?
David W. Allan introduced the statistic at the U.S. National Institute of Standards and Technology (NIST) in 1966, and it remains the internationally accepted way to describe random frequency instabilities under IEEE Std 1139. When a quality manager receives a frequency-standard calibration certificate, the reported figure, say, a frequency offset of −2.3 × 10⁻¹¹, is a snapshot. It says nothing about whether the device holds that value or drifts away an hour later. Allan deviation, written σy(τ), fills that gap by describing stability as a function of averaging time.
This distinction matters in the real world. A telecom timing card, a GPS-disciplined reference feeding a 5G base station, or a lab house standard can each pass a point-frequency check yet behave very differently over the intervals that matter to your application. That is why Techmaster’s ISO/IEC 17025 accredited time and frequency calibration service characterizes stability, not just offset, for oscillators and frequency standards.
Why can’t you just use standard deviation for oscillator stability?
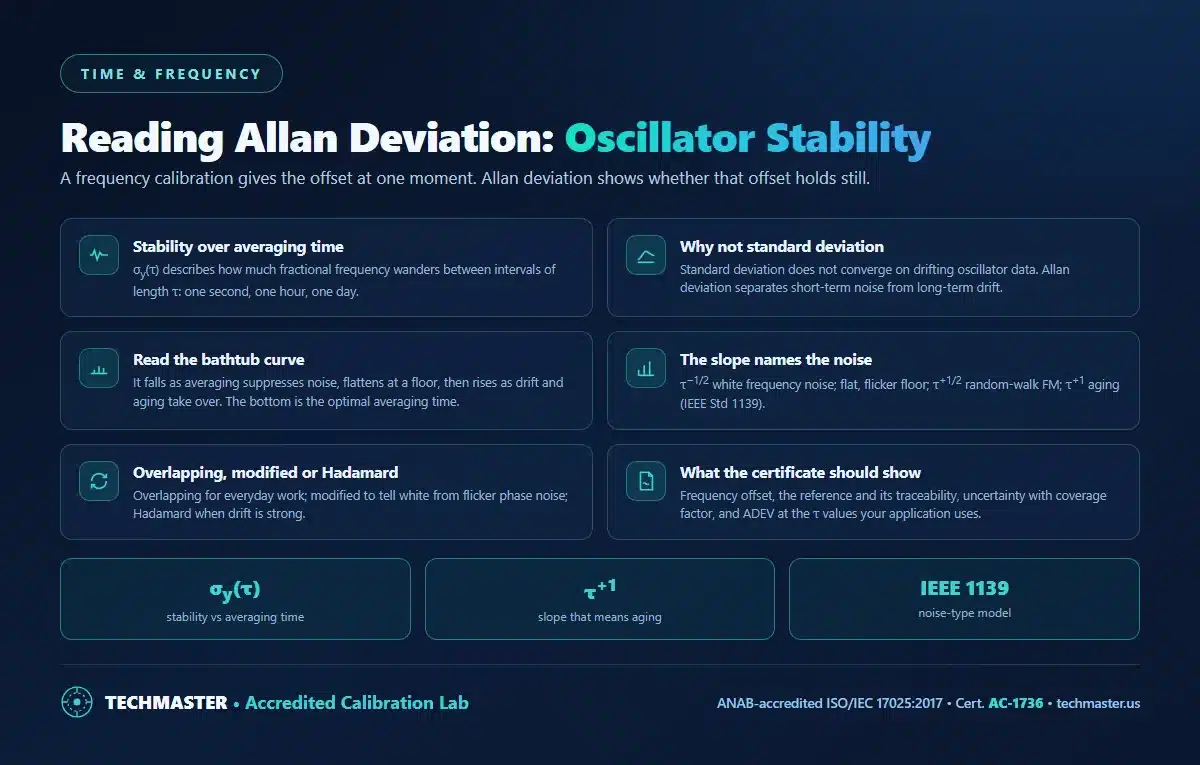
Feed a day of frequency data from a rubidium standard into an ordinary standard-deviation calculation and the answer depends on how long you measured: longer records give larger numbers, forever. That is useless for specifying a device. The Allan variance solves this by working on first differences of consecutive frequency samples. Formally, for a series of fractional-frequency values y averaged over intervals τ, the Allan variance is half the mean squared difference of adjacent values, and the Allan deviation is its square root. This construction is convergent for the power-law noise types that dominate real oscillators, per NIST’s time-domain stability statistics.
The practical payoff: one ADEV curve captures both the fast measurement noise at short τ and the slow environmental wander at long τ, on a single plot, without the drift term poisoning the result.
How do you read an Allan deviation plot and find the optimal averaging time?
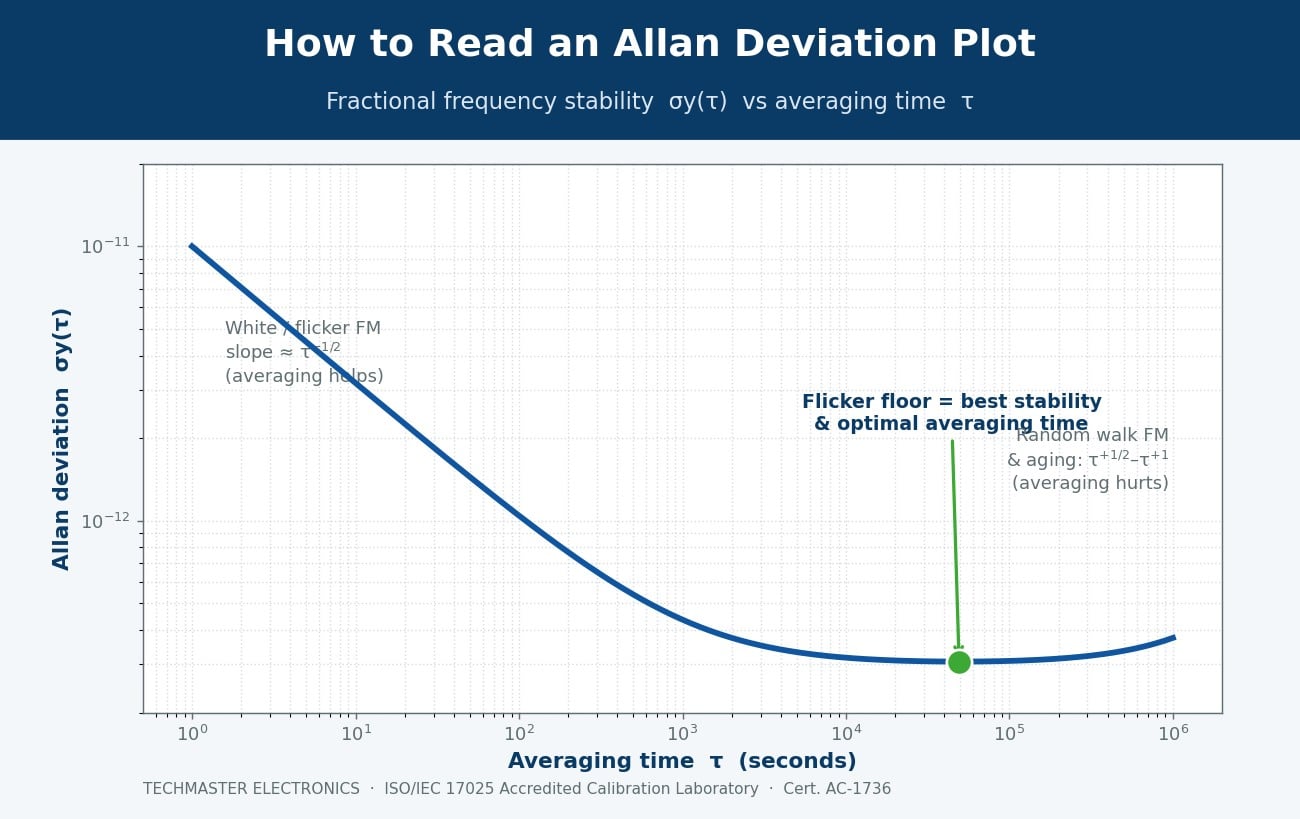
The left side of the curve, where σy(τ) decreases with τ, is where averaging longer helps, random noise averages out. The flat bottom is the flicker floor, the best stability the oscillator can reach; averaging beyond it buys you nothing. The right side, where the curve turns up, is where random-walk and aging effects dominate and averaging longer actually hurts. Choosing your measurement or gate time to sit near that minimum extracts the most performance from the device. This is the kind of insight a raw certificate number cannot give you, and it is central to how we advise clients on oscilloscope and instrument calibration intervals that depend on internal timebases.
What do the slopes on an ADEV plot tell you about noise?
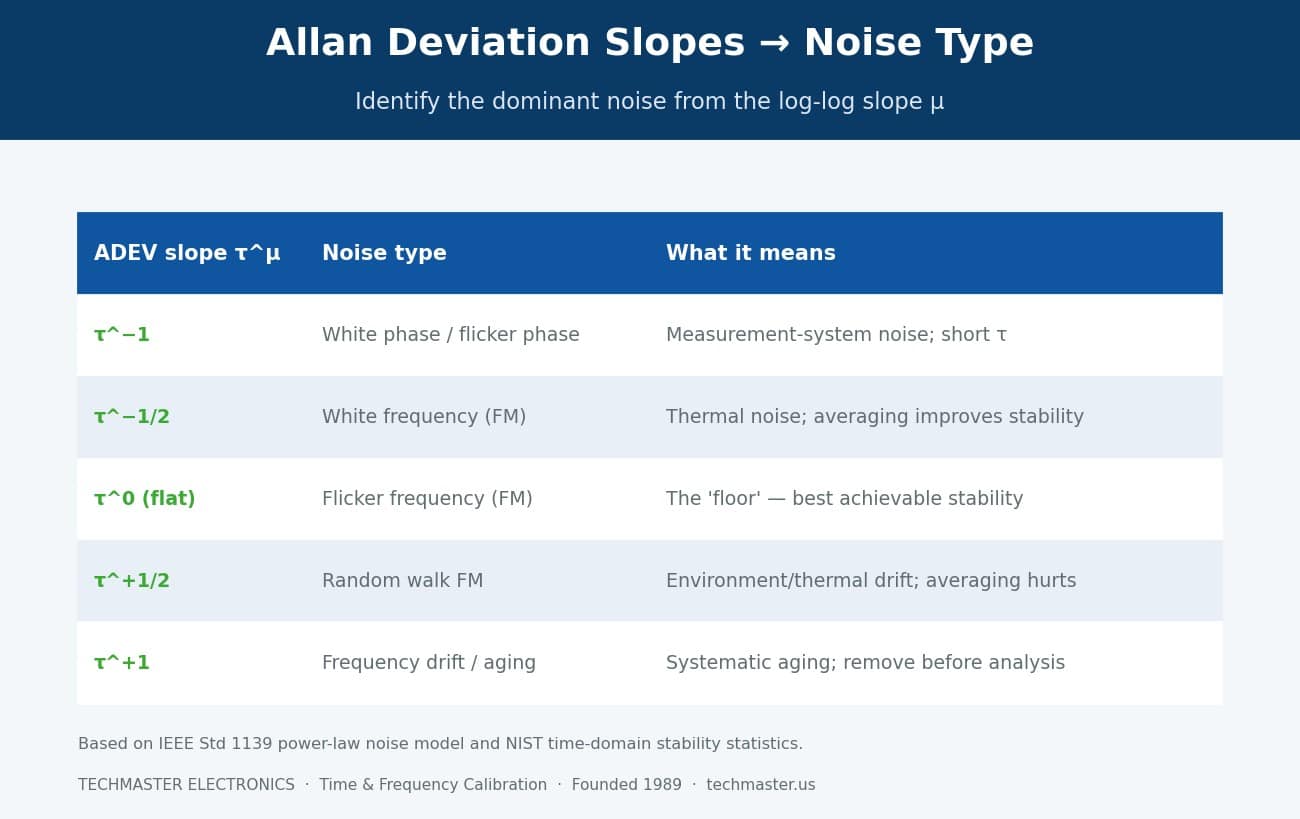
This slope analysis is diagnostic gold. A curve that keeps falling at τ−1/2 is white frequency noise, the device is thermal-noise limited and averaging helps. A flat section is flicker frequency noise, the intrinsic floor. An upturn at τ+1/2 signals random-walk FM, usually driven by temperature and environment. A steep τ+1 ramp is deterministic aging that should be removed before analysis. The table below summarizes the mapping.
| ADEV slope (τμ) | Dominant noise type | Physical meaning & action |
|---|---|---|
| τ−1 | White / flicker phase noise | Measurement-system and buffer noise; visible at short τ. Improve the counter or reference. |
| τ−1/2 | White frequency (FM) | Thermal noise floor of the resonator. Averaging longer improves stability. |
| τ0 (flat) | Flicker frequency (FM) | The intrinsic “floor”, best achievable stability. Cannot be averaged away. |
| τ+1/2 | Random walk FM | Environmental / thermal wander. Stabilize temperature; averaging now hurts. |
| τ+1 | Frequency drift / aging | Systematic crystal aging. Remove the linear trend before computing ADEV. |
When should you use overlapping, modified, or Hadamard deviation?
The plain (non-overlapping) Allan deviation wastes data. The overlapping version reuses every possible sample pair at each τ, tightening the confidence intervals, it is the default in modern analysis software and in our lab reports. For the mathematical definitions of each statistic, see the NIST Handbook of Frequency Stability Analysis. The modified Allan deviation (MDEV) adds an extra phase-averaging step that changes the slope for white phase noise, letting you tell white and flicker phase noise apart, important when qualifying low-noise distribution amplifiers. The Hadamard deviation uses second differences instead of first, so it is insensitive to linear frequency drift and is the right tool for rubidium and cesium standards that age. Choosing the correct statistic is part of a defensible measurement, and it ties directly to the uncertainty reporting expected under an ANAB-accredited ISO/IEC 17025 scope (Cert. AC-1736).
What should an ISO/IEC 17025 time & frequency certificate include?
Too many certificates stop at a single offset number. For a house standard, a GPS-disciplined oscillator, or a frequency counter’s timebase, that is not enough to make an engineering decision. A rigorous report states the traceability chain back to Coordinated Universal Time as maintained by NIST, the confidence limits on the ADEV estimate (which widen at long τ where fewer independent samples exist), and whether aging was removed. Techmaster has issued traceable calibration certificates since 1989 and draws on a 10-year internal dataset of more than 381,916 calibrations across 4,913 manufacturers to benchmark expected performance by instrument class. Related timebase-dependent work is covered in our function generator calibration guide, and the complete discipline lineup is on the Techmaster calibration hub.
How stable an oscillator do you actually need?
| Oscillator type | Typical σy(1 s) | Stability at ~1 day | Best fit |
|---|---|---|---|
| TCXO | ~1 × 10⁻⁹ | Drift-dominated | General benchtop instruments |
| OCXO | ~1 × 10⁻¹² | ~1 × 10⁻¹⁰ | Short-term precision; phase noise |
| Rubidium (Rb) | ~3 × 10⁻¹² | ~1 × 10⁻¹² | Holdover, medium-term stability |
| Cesium (Cs) | ~5 × 10⁻¹² | ~1 × 10⁻¹⁴ | Primary standard, long-term accuracy |
| GPS-disciplined (GPSDO) | OCXO short-term | ~1 × 10⁻¹³ | Traceable long-term reference |
Values are representative order-of-magnitude figures; actual performance depends on the specific model, environment, and warm-up. The point is structural: short-term needs favor an OCXO’s low near-in noise, while long-term traceability favors cesium or a disciplined GPS reference. The only way to confirm a given unit meets your target is to measure its Allan deviation at the averaging times you actually use.
Key takeaways
- ADEV ≠ a frequency offset. A certificate offset is a snapshot; Allan deviation shows how stability behaves across averaging times.
- It converges where standard deviation fails. First-differencing cancels drift, so ADEV gives a meaningful number on real, non-stationary oscillators.
- The bathtub minimum is your sweet spot. The flicker floor marks best stability and the optimal averaging time.
- Slope reveals the noise physics. From τ−1 phase noise to τ+1 aging, the slope diagnoses the cause.
- Report it properly. An ISO/IEC 17025 certificate should state ADEV, uncertainty, traceability, and drift handling, not just one number.
Frequently asked questions
Is Allan deviation the same as Allan variance?
No. The Allan variance is the statistical quantity; the Allan deviation is its square root and is expressed in the same units as fractional frequency. Engineers almost always plot and report the Allan deviation, written σy(τ), because it is directly comparable to a fractional-frequency specification.
What averaging time (τ) should I use when measuring stability?
Measure across a range of τ values, typically from your shortest practical gate time out to the longest interval your application cares about. The full curve, not a single point, is what reveals the flicker floor and the optimal averaging time for your specific use case.
Does a lower Allan deviation always mean a better oscillator?
Lower is better only at the averaging time that matters to you. An OCXO can beat a cesium standard at one second yet be far worse at one day. Always compare oscillators at the τ that matches your measurement, not at a single headline number.
How does Allan deviation relate to phase noise?
They describe the same instabilities in different domains: phase noise is a frequency-domain (spectral) measure, and Allan deviation is its time-domain counterpart. IEEE Std 1139 defines the mathematical translation between the two, so a lab can convert between phase-noise plots and ADEV curves.
Can Techmaster calibrate my frequency standard and report Allan deviation?
Yes. Techmaster’s ISO/IEC 17025 accredited time and frequency calibration (ANAB Cert. AC-1736) provides traceable frequency calibration and stability characterization, including Allan deviation at application-relevant averaging times, for oscillators, frequency counters, and GPS-disciplined references.
Need traceable stability characterization for your frequency standard?
Techmaster’s ISO/IEC 17025 accredited labs report frequency offset, uncertainty, and Allan deviation you can defend in an audit.
Related reading: Does a GPS-disciplined oscillator need calibration? GPS lock vs ISO/IEC 17025 traceability

Khanh Nguyen is the Marketing Manager at Techmaster Electronics, a B2B marketing leader covering the test, measurement, and ISO/IEC 17025 accredited calibration industry across the US and Vietnam markets.