
TL;DR: A measurement uncertainty budget is a structured table that lists every source of doubt in a calibration, converts each to a standard uncertainty, combines them by root-sum-of-squares into a combined standard uncertainty, and multiplies by a coverage factor (k = 2) to report an expanded uncertainty at about 95% confidence. ISO/IEC 17025:2017 §7.6 requires accredited labs to build one for every calibration, following the GUM (JCGM 100:2008).
What is a measurement uncertainty budget?
The GUM (the international Guide to the Expression of Uncertainty in Measurement, JCGM 100:2008) defines measurement uncertainty as a “parameter… that characterizes the dispersion of the values that could reasonably be attributed to the measurand.” A budget is simply how a lab makes that dispersion visible and defensible. Without it, a certificate’s ± value is a guess; with it, the number is traceable to documented physics and statistics.
ISO/IEC 17025:2017 §7.6 makes the budget mandatory: an accredited laboratory must identify the contributions to measurement uncertainty and account for them using appropriate methods. At Techmaster Electronics, an ANAB-accredited ISO/IEC 17025 calibration laboratory (Cert. AC-1736), founded 1989 with four accredited US labs, every discipline’s reported uncertainty traces back to a budget like the one below.
Type A vs Type B uncertainty: what’s the difference?
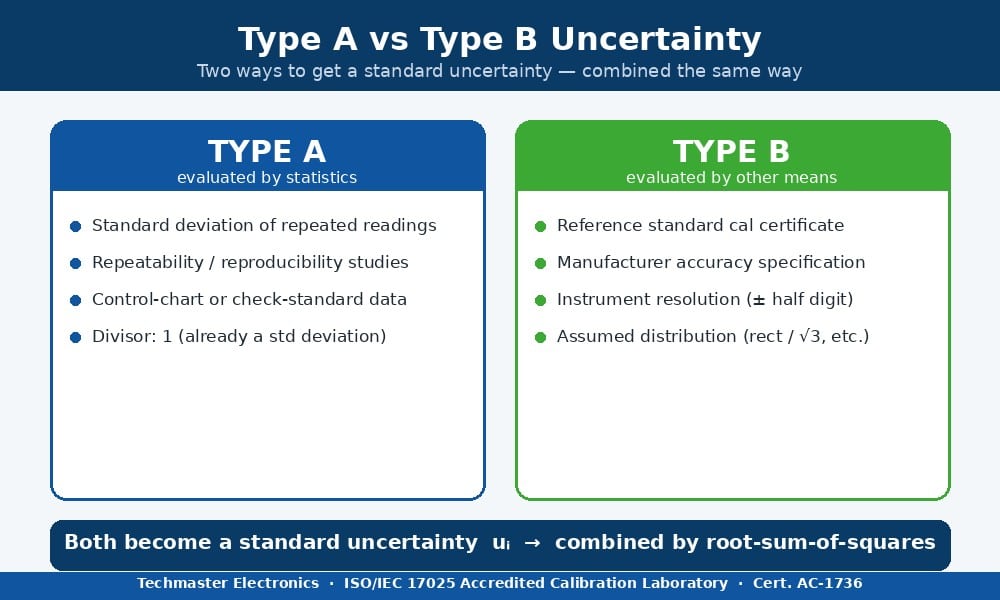
The Type A / Type B split describes how you got the number, not how important it is. As NIST explains in its measurement uncertainty overview, Type A components are found by statistics on the data you collected, while Type B components draw on external information. A repeatability study of ten readings gives a Type A term; a reference standard’s calibration certificate gives a Type B term. Neither is inherently larger, and both feed the same combination step.
The authoritative US reference for the mechanics is NIST Technical Note 1297, Guidelines for Evaluating and Expressing the Uncertainty of NIST Measurement Results (Taylor & Kuyatt, 1994), which operationalizes the GUM for practical calibration work.
What are the eight steps to build an uncertainty budget?
The process is always the same, whether you are calibrating a gauge block, a power sensor, or a thermometer:
- Define the measurand and model Y = f(X1…Xn), what you are measuring and how it depends on inputs.
- Identify every uncertainty source, reference, environment, UUT resolution, repeatability, method.
- Quantify each source as a standard uncertainty in consistent units (see the divisor table below).
- Apply sensitivity coefficients (ci) that translate an input change into an output change.
- Combine the weighted terms by root-sum-of-squares into the combined standard uncertainty uc.
- Estimate effective degrees of freedom (Welch–Satterthwaite) when sample sizes are small.
- Choose a coverage factor k, k = 2 gives roughly 95% confidence for a normal distribution.
- Report the expanded uncertainty U = k × uc, the coverage factor, and the confidence level.
How do you turn each source into a standard uncertainty?
Mixing raw ± limits without normalizing them is the most common budget error. Each source must first be reduced to a standard uncertainty using the correct divisor for its distribution:
| Distribution | When it applies | Divisor | Standard uncertainty |
|---|---|---|---|
| Normal (Gaussian) | Calibration certificate stating U and k; repeatability data | k (usually 2) | u = U ÷ k |
| Rectangular (uniform) | Resolution, manufacturer ± spec, temperature limits | √3 ≈ 1.732 | u = a ÷ √3 |
| Triangular | Values more likely near the center than the edges | √6 ≈ 2.449 | u = a ÷ √6 |
| U-shaped | RF mismatch, some cyclic effects | √2 ≈ 1.414 | u = a ÷ √2 |
Here a is the semi-range (half-width) of the limit. Instrument resolution, for example, contributes a rectangular half-width of half the least significant digit. Once every source is a standard uncertainty, they can finally be combined.
Worked example: an uncertainty budget for a thermometer
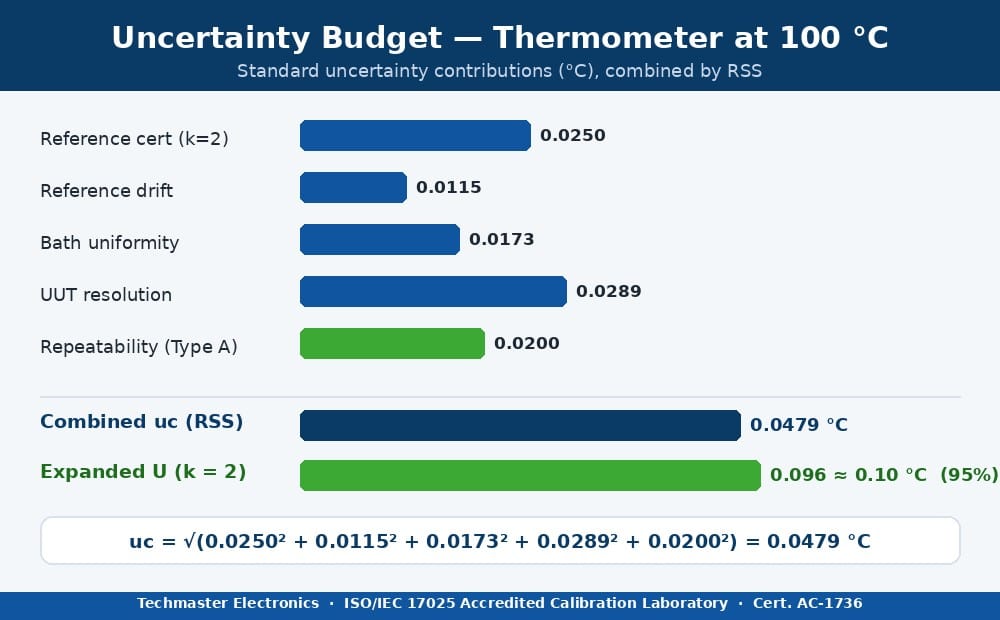
The budget makes each contribution and its distribution explicit, so an assessor can reproduce the result:
| Uncertainty source | Type | Value (±) | Distribution | Divisor | Std. uncertainty (°C) |
|---|---|---|---|---|---|
| Reference thermometer (cal certificate, k = 2) | B | 0.050 °C | Normal | 2 | 0.0250 |
| Reference drift / stability since last cal | B | 0.020 °C | Rectangular | √3 | 0.0115 |
| Bath temperature uniformity | B | 0.030 °C | Rectangular | √3 | 0.0173 |
| UUT display resolution (0.1 °C) | B | 0.050 °C | Rectangular | √3 | 0.0289 |
| Repeatability (std. dev. of the mean, n = 10) | A | 0.020 °C | Normal | 1 | 0.0200 |
| Combined standard uncertainty uc | RSS | 0.0479 | |||
| Expanded uncertainty U (k = 2, ~95%) | 0.096 ≈ 0.10 |
The combined value comes from squaring each standard uncertainty, summing, and taking the square root: √(0.0250² + 0.0115² + 0.0173² + 0.0289² + 0.0200²) = 0.0479 °C. Notice that resolution and bath uniformity dominate here, a clear signal of where to invest if a tighter uncertainty is needed. This is the same logic Techmaster applies across a 10-year dataset of 381,916 calibrations spanning 4,913 manufacturers to keep reported uncertainties realistic and defensible.
How does the budget connect to TUR, CMC, and your certificate?
The budget is not an academic exercise; it is the source of the numbers customers actually rely on. The expanded uncertainty you compute here is exactly the value used to decide pass or fail, see our guide to the test uncertainty ratio and decision rules. A lab’s smallest achievable uncertainty, drawn from its best budgets, becomes the CMC on its ISO/IEC 17025 accreditation scope. And the final ± figure is what appears on the report, learn to interpret it in how to read an ISO/IEC 17025 calibration certificate. For temperature work specifically, the reference chain matters too, as covered in Techmaster’s thermodynamic calibration discipline, part of our full accredited calibration services. The ILAC guidance on uncertainty (ILAC-G17) is listed in the ILAC Guidance Series.
Key takeaways
- An uncertainty budget lists every source of doubt, converts each to a standard uncertainty, and combines them by root-sum-of-squares.
- Type A uncertainty comes from statistics on repeated readings; Type B comes from certificates, specs, resolution, and assumed distributions.
- Normalize each source with the right divisor, k for normal, √3 for rectangular, √6 for triangular, before combining.
- Expanded uncertainty U = k × uc, with k = 2 giving about 95% confidence; that value goes on the certificate.
- ISO/IEC 17025:2017 §7.6 requires the budget, and its output feeds the TUR, the decision-rule guardband, and the lab’s CMC.
Frequently asked questions
Does ISO/IEC 17025 require an uncertainty budget for every calibration?
Yes. ISO/IEC 17025:2017 §7.6 requires accredited calibration laboratories to identify the contributions to measurement uncertainty and evaluate the uncertainty of measurement for every calibration. The budget is the documented evidence that this was done, and assessors review it during accreditation.
What is the difference between combined and expanded uncertainty?
The combined standard uncertainty (u_c) is the root-sum-of-squares of all the individual standard uncertainties. The expanded uncertainty (U) is the combined value multiplied by a coverage factor k, usually 2, to give a wider interval with about 95% confidence. The expanded uncertainty is the figure reported on the certificate.
Why divide a rectangular distribution by the square root of 3?
A rectangular (uniform) distribution assumes the true value is equally likely anywhere within its limits. The standard deviation of a uniform distribution over a half-width a is a divided by the square root of 3. Dividing by the square root of 3 converts the stated limit into a standard uncertainty that can be combined with the others.
Which uncertainty sources should I include in the budget?
Include the reference standard, its drift since calibration, environmental effects such as temperature and bath uniformity, the unit under test resolution, repeatability, and any method or setup effects. Any source that could reasonably shift the result belongs in the budget; leaving out a significant one understates the uncertainty.
What coverage factor should I use?
For a result dominated by normally distributed components with large degrees of freedom, k = 2 gives approximately 95% confidence and is the usual choice. When sample sizes are small, the effective degrees of freedom (Welch-Satterthwaite) may call for a larger k to preserve 95% coverage.
How does the uncertainty budget affect pass or fail decisions?
The expanded uncertainty from the budget sets the guardband in a decision rule and the Test Uncertainty Ratio. A larger uncertainty relative to the tolerance means a lower TUR and a wider guardband, which makes borderline results more likely to be reported as fail to protect against false accepts.
Need calibration with a defensible uncertainty budget?
Techmaster’s ANAB-accredited labs document a full GUM uncertainty budget behind every certificate. Founded 1989 · ISO/IEC 17025 Cert. AC-1736.
Request a Calibration QuoteRelated reading: Allan deviation explained: measuring oscillator and frequency-standard stability
Related reading: Why calibration labs control temperature and humidity in an ISO/IEC 17025 lab
Related reading: why a pH verification buffer is what makes an uncertainty statement defensible
Related reading: the worked EURAMET cg-13 uncertainty budget for a dry-block calibrator
Related reading: evaluating GPS-disciplined oscillator time and frequency uncertainty
Related reading: a worked noise figure uncertainty budget dominated by noise source ENR calibration
Related reading: how ASTM E4 and ISO 7500-1 treat calibration uncertainty on tensile testers
Related reading: how ISO/IEC 17025 decision rules and guardbanding turn that uncertainty budget into a pass or fail verdict.

Khanh Nguyen is the Marketing Manager at Techmaster Electronics, a B2B marketing leader covering the test, measurement, and ISO/IEC 17025 accredited calibration industry across the US and Vietnam markets.