
Quick answer: Accuracy is how close a measurement is to the true, NIST-traceable value; precision is how closely repeated measurements agree with each other; and resolution is the smallest change an instrument can display or detect. A device can be precise but inaccurate, or high-resolution yet inaccurate, only calibration against traceable standards ties readings to a true value. Techmaster’s ISO/IEC 17025 calibrations quantify accuracy with a documented measurement-uncertainty budget so you know how far a reading can be trusted.
Key points
- Calibration calibration confirms measurements you can defend in an ISO 9001 / 13485 / AS9100 audit.
- Every certificate is NIST-traceable with a full measurement-uncertainty budget (as-found / as-left).
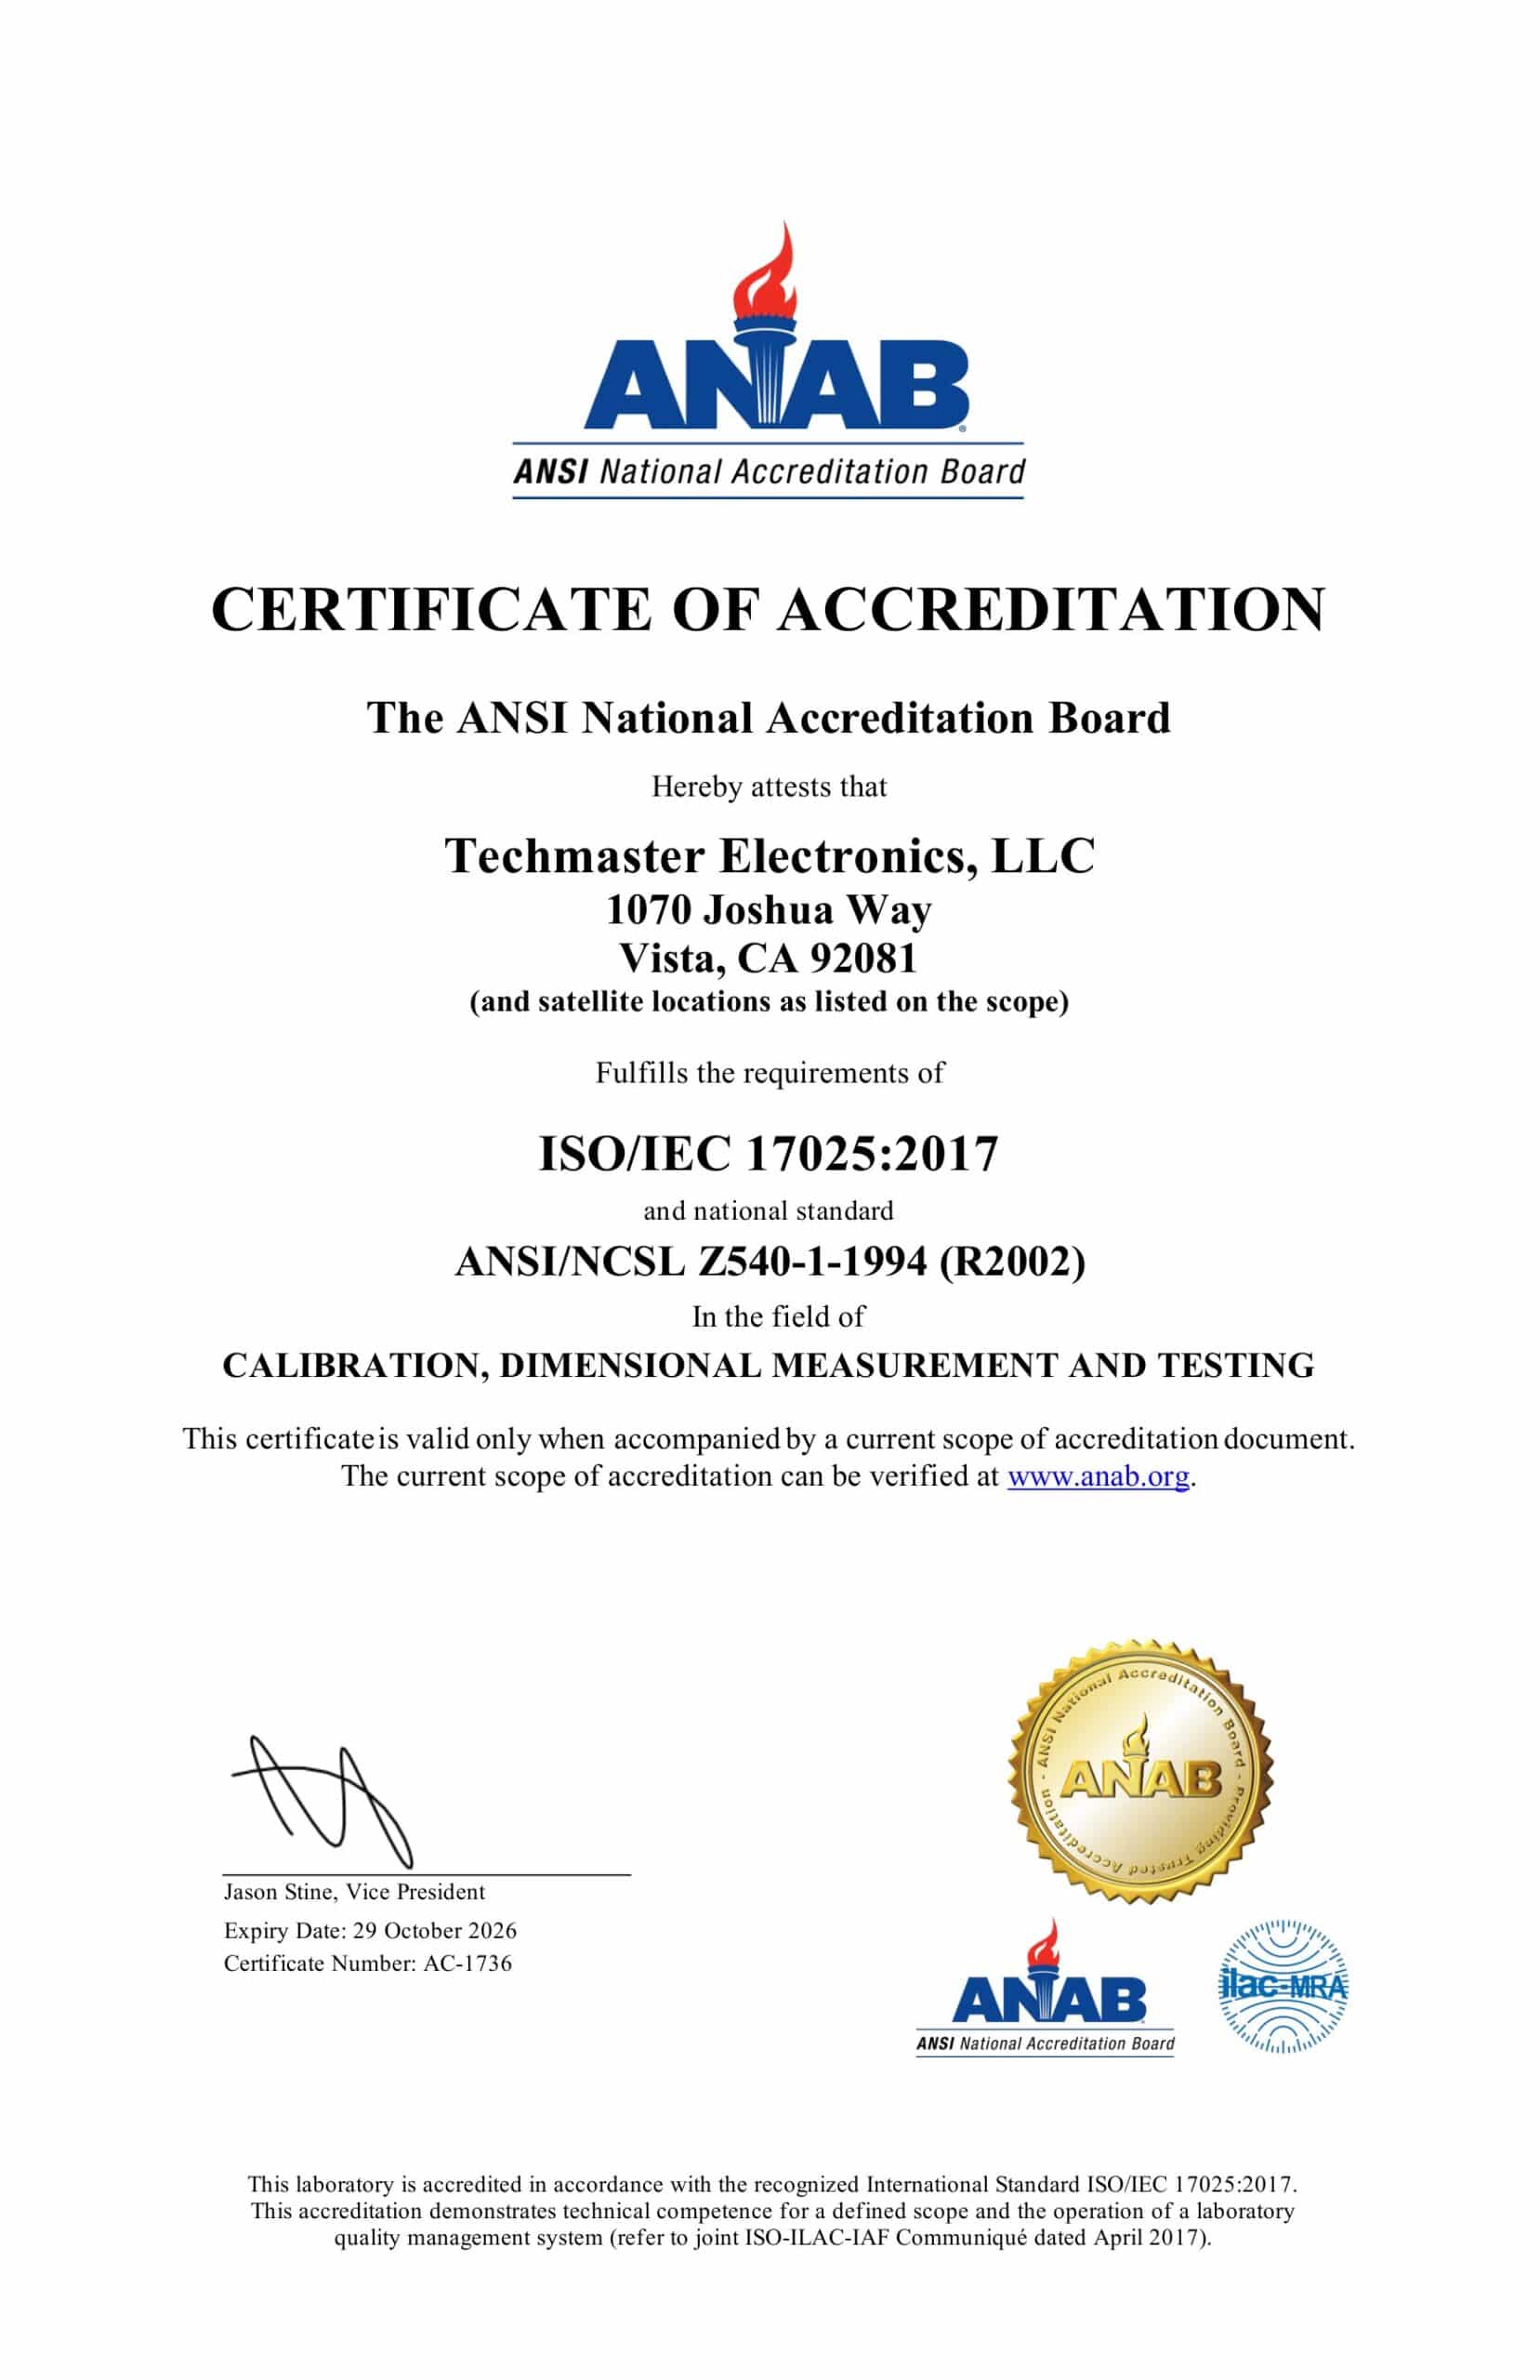
- Techmaster is ANAB-accredited (AC-1736) with five US labs, in-lab or nationwide on-site.
- Standard turnaround is 5 business days, with 1–2 business-day expedite available.
Accuracy, precision, and resolution describe different parts of measurement performance. Accuracy concerns closeness to a reference value, precision concerns agreement among repeated results, and resolution is the smallest change that produces a perceptible change in indication. A high-resolution display can show many digits while the measurements remain biased, variable, or too uncertain for the decision.
The three terms at a glance
| Term | Practical question | What can reveal it? |
|---|---|---|
| Accuracy | How close is the result to an accepted reference value? | Comparison with a suitable reference, considering uncertainty |
| Precision | How closely do repeated results agree under stated conditions? | A series of repeat measurements and their spread |
| Resolution | What is the smallest input change that causes a perceptible indication change? | Display increment, scale interval, noise, friction, and instrument behavior |
The International Vocabulary of Metrology (VIM) entry for accuracy treats accuracy as a qualitative concept rather than a numeric quantity. The VIM defines measurement precision through agreement among replicate indications or measured values under specified conditions, and resolution through a perceptible change in indication.

Worked example: one gauge block, five readings
Illustrative scenario: a digital caliper with a 0.01 mm display increment measures a reference whose assigned value is 25.000 mm. The reference value and calibration setup have their own uncertainty; the numbers below are simplified for teaching.
| Reading | Indication | Indication minus reference |
|---|---|---|
| 1 | 25.04 mm | +0.04 mm |
| 2 | 25.03 mm | +0.03 mm |
| 3 | 25.04 mm | +0.04 mm |
| 4 | 25.04 mm | +0.04 mm |
| 5 | 25.03 mm | +0.03 mm |
The average indication is 25.036 mm. The readings cluster within 0.01 mm, so repeatability under these conditions appears good. Yet the average is about 0.036 mm above the assigned reference value. The instrument can therefore be precise in this short test while showing a systematic offset. Whether it is acceptable depends on the applicable specification, the measurement uncertainty, and the decision rule.
An original visual model
Reference:          |
Readings:          ...
Axis:      low-------------high
Reference:          |
Readings:               ...
Axis:      low-------------high
Reference:          |
Readings:     .     .     .
Axis:      low-------------high
Reference:          |
Readings:          .    .    .
Axis:      low-------------high

Resolution does not set the uncertainty
A 0.01 mm display increment only tells you something about how the instrument indicates changes. It does not prove ±0.01 mm accuracy and does not make total measurement uncertainty 0.01 mm. Uncertainty can include the reference standard, repeatability, resolution, alignment, contact force, temperature, method, and other influence quantities. Some components may be larger than the display increment.
Conversely, a coarse display may hide small changes even when other parts of the measurement system are stable. The number of digits is therefore an input to instrument selection, not a complete performance statement.
Where measurement uncertainty fits
Measurement error is the difference between a measured value and a reference quantity value. Measurement uncertainty describes the dispersion of values that could reasonably be attributed to the measurand based on the available information. Uncertainty is not a known error bar that can simply be subtracted from every result.
When a calibration report states a result such as 25.036 mm with expanded uncertainty 0.012 mm and coverage factor k = 2, the reported interval qualifies the measurement result. Under common assumptions, k = 2 often corresponds to approximately 95% coverage, but the exact interpretation depends on the evaluation. See NIST Technical Note 1297.

How to diagnose a measurement problem
- Define the measurand and reference value, including units and conditions.
- Take repeated readings without changing the setup more than the procedure allows.
- Examine spread to assess repeatability under those conditions.
- Compare the mean or fitted result with the reference, including uncertainty, to investigate bias.
- Check multiple points across the working range. A single point can miss linearity or local error.
- Do not adjust the instrument until as-found results are recorded.
- Compare the result and uncertainty with the intended tolerance using an agreed decision rule.
For a dimensional example, see caliper calibration. For the reporting concepts behind the result, read measurement uncertainty and traceability explained.
Why it matters
Measurement confidence
A drifting calibration produces readings that fail under audit scrutiny.
Compliance
ISO 9001, 13485, AS9100 and FDA systems require traceable calibration.
Cost control
Catching drift early prevents scrapped product and failed lots.
Traceability
An unbroken chain to NIST with stated uncertainty makes your data valid.
Accredited calibration at Techmaster
Techmaster Electronics is an ANAB-accredited (Certificate AC-1736) ISO/IEC 17025:2017 calibration laboratory with five US labs, NIST-traceable standards and a full measurement-uncertainty budget on every certificate, in-lab or on-site nationwide. See our calibration services or request a quote.
Frequently asked questions
What is accuracy vs precision vs resolution?
Accuracy Vs Precision Vs Resolution is the documented comparison of a calibration against NIST-traceable reference standards under ISO/IEC 17025. It quantifies the calibration’s error and measurement uncertainty and confirms it performs within tolerance, with as-found and as-left data on the certificate.
How often should a calibration be calibrated?
Most quality systems calibrate a calibration every 12 months, or sooner after repair, overload, or before critical measurements. Set your interval from the manufacturer spec and your ISO 9001 / 13485 / AS9100 program and drift history.
Is Techmaster’s calibration calibration ISO 17025 accredited?
Yes. Techmaster Electronics is ISO/IEC 17025:2017 accredited by ANAB (Certificate AC-1736). Every calibration calibration is NIST-traceable and issued with a full measurement-uncertainty budget.
What is the turnaround for calibration calibration?
Standard turnaround is 5 business days, with 1–2 business-day expedite available. On-site calibration removes shipping time entirely for calibrations that can’t leave the floor.
Do you calibrate calibrations on-site or in-lab?
Both. Techmaster runs five US labs (Vista CA, Santa Clara CA, Orlando FL, San Antonio TX, Holly Springs NC) and offers nationwide on-site calibration calibration to minimize downtime.
Related calibration guides
Get accredited calibration
ANAB-accredited, NIST-traceable, 5 US labs, in-lab or on-site.
Contact us for a quoteKhanh Nguyen, Marketing Manager, Techmaster Electronics
Writes on ISO/IEC 17025 calibration, metrology and measurement compliance for US labs. Connect on LinkedIn →

Khanh Nguyen is the Marketing Manager at Techmaster Electronics, a B2B marketing leader covering the test, measurement, and ISO/IEC 17025 accredited calibration industry across the US and Vietnam markets.