
Chart recorders, both paper and paperless, are still the record of truth for autoclaves, ovens, cold rooms and process lines. Auditors read the chart, not the controller display, so a recorder that drifts can turn a good process into a failed batch on paper.
Chart recorder calibration checks that each channel records what its sensor actually sees, and that the time axis is correct.
Input calibration by simulation
Each channel is checked by feeding it a known signal from a calibrated source, at several points across its range:
- Thermocouple channels: simulated millivolt signals for the thermocouple type, with cold-junction compensation checked.
- RTD channels: simulated resistance values.
- mA and voltage channels: precision current or voltage.
The recorded value is compared with the simulated value, and the error at each point is reported before and after any adjustment.
Pens, display and chart speed
On paper recorders, the pen or print position must match the recorded value on the chart scale, and the chart must advance at the set speed. A chart that runs fast or slow misstates how long a process held temperature. On paperless recorders, the stored data and the time stamps are checked, along with any alarm set points that trigger on a channel.
Don’t forget the sensors
Simulation proves the recorder, not the probe connected to it. For temperature channels, the sensors should be calibrated too, either separately or as a loop with the recorder. See temperature probe calibration. Where a recorder documents a validated process, such as sterilization or cold storage, follow your validation protocol for loop checks and intervals.
Calibration intervals
Annual calibration is common, and critical process recorders are often checked every six months. Recalibrate after repairs, input card changes or firmware updates. For loggers and digital recorders, see our temperature and humidity recorder guide.
Accreditation and certificates
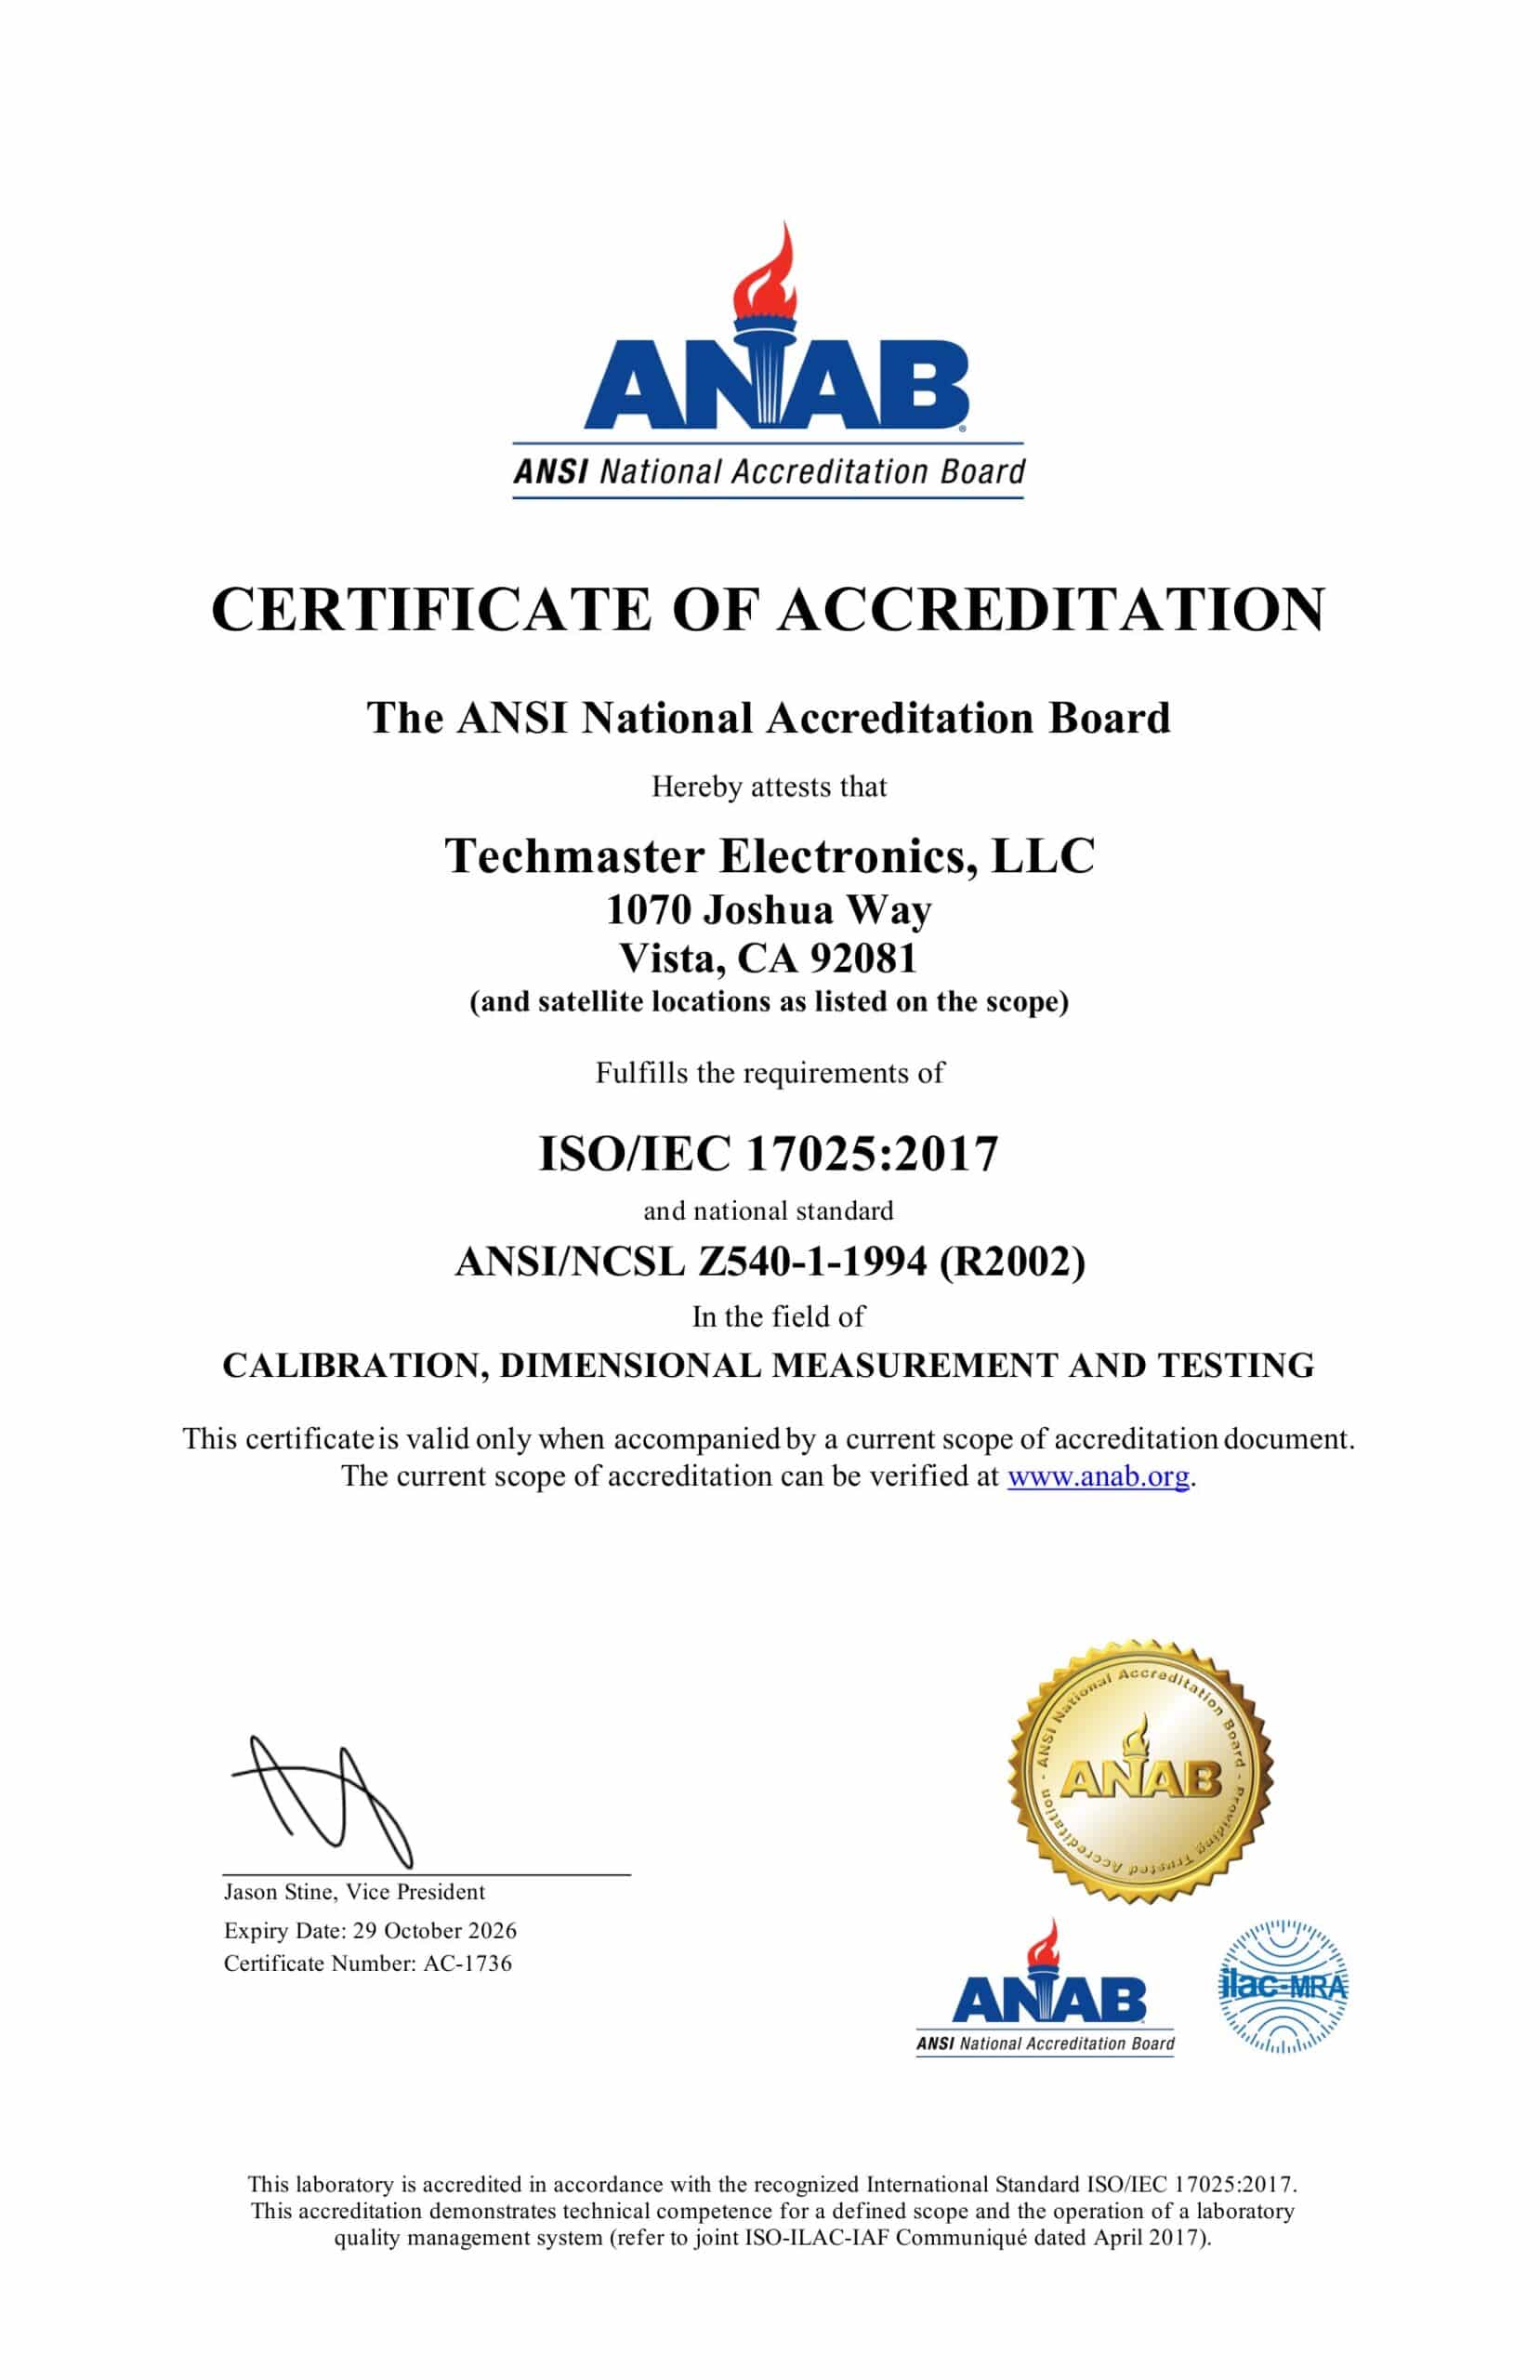
Thermocouple and RTD simulation, and DC voltage and current, are on Techmaster’s ANAB ISO/IEC 17025 scope (certificate AC-1736), so the input checks on a chart recorder can be reported as accredited results within the listed ranges. Sensor and chart-speed checks are NIST-traceable.
Frequently asked questions
How is a chart recorder calibrated?
Does calibrating the recorder cover the temperature sensor?
How often should chart recorders be calibrated?
Is chart recorder calibration accredited?
Related calibration guides

Khanh Nguyen is the Marketing Manager at Techmaster Electronics, a B2B marketing leader covering the test, measurement, and ISO/IEC 17025 accredited calibration industry in the United States.