
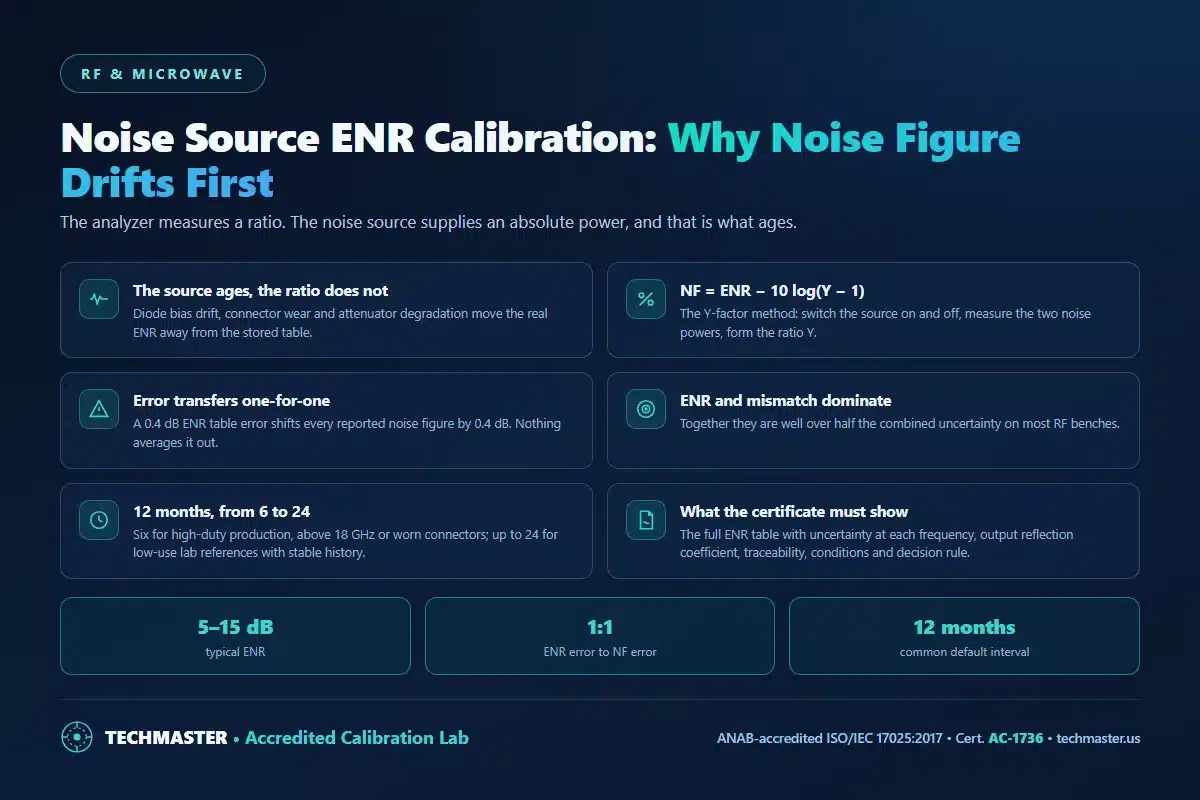
Noise source ENR calibration re-measures the excess noise ratio table your analyzer trusts as a constant. Because reported noise figure equals ENR minus 10 log(Y−1), any ENR table error transfers into your result one-for-one. A 0.4 dB drift silently fails good amplifiers or passes bad ones, and no instrument self-test will catch it, which makes ENR calibration the limiting factor in noise figure accuracy.
What is noise source ENR calibration?
Every solid-state noise source ships with an ENR table: a list of frequencies and the corresponding excess noise ratio, typically 5 dB to 15 dB for commercial units. That table is not a nameplate rating. It is a measured, artifact-specific characterisation of one particular avalanche diode, its bias circuit and its output attenuator, and it is the single reference standard in the entire noise figure measurement.
This is what makes a noise source unusual among RF artifacts. A calibrated RF power sensor has a calibration factor you can sanity-check against a second sensor. A noise source has no easy field cross-check, the quantity it generates is random, broadband and invisible on a spectrum display. You either trust the table or you recalibrate it.
The traceability chain terminates at national standards. NIST maintains the primary noise and phase-noise artifacts and offers dedicated phase and amplitude noise calibration services (service codes 77135C and 77140S) that anchor commercial noise metrology in the United States. An accredited laboratory transfers that traceability to your working noise source through a calibrated radiometer or a reference standard noise source.
Why does noise figure drift before the analyzer does?
The Y-factor method makes this dependency explicit. The analyzer switches the noise source on and off, measures the two noise powers, and forms the ratio Y. Noise figure then follows as NF = ENR − 10 log10(Y − 1). The measured quantity, Y, is a ratio, gain errors and detector scaling largely cancel. The ENR term is not measured at all during your test. It is read from a file.
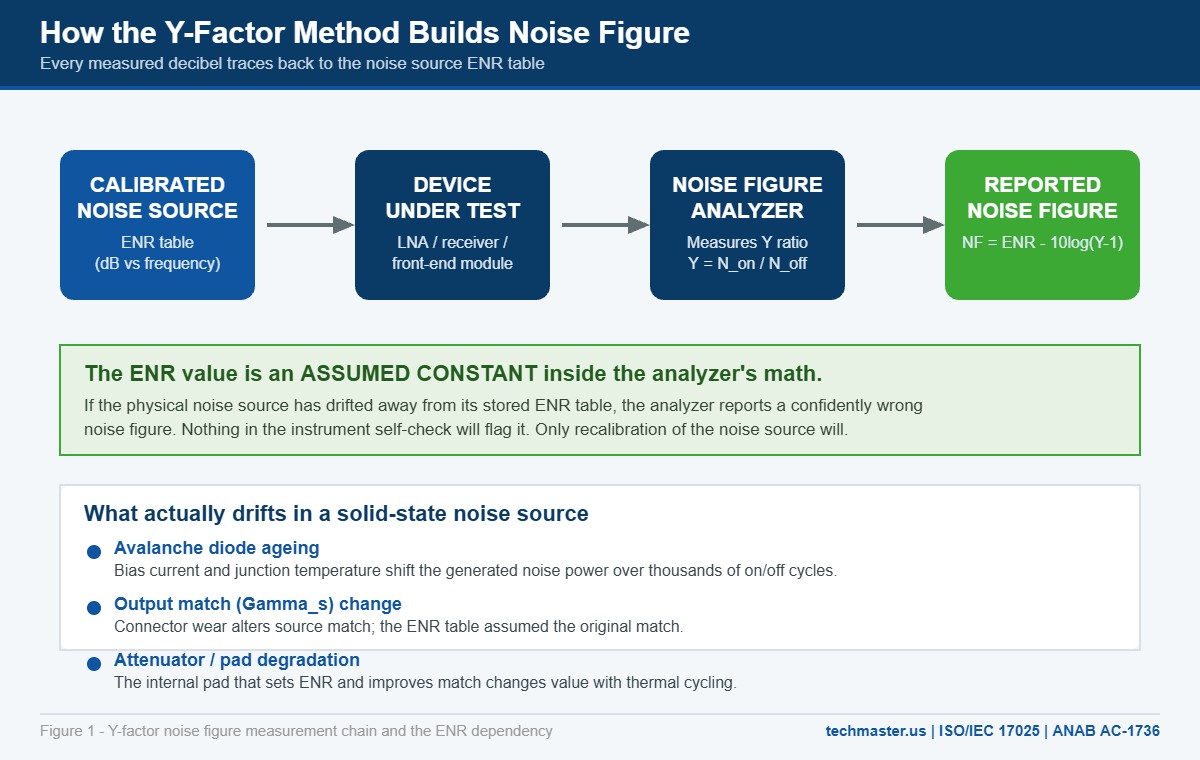
Three physical mechanisms move a noise source off its table. First, the avalanche diode ages: bias current and junction temperature shift the generated noise power over thousands of on/off switching cycles, and high-duty-cycle production test benches accumulate those cycles fast. Second, the output match changes as the connector wears, which matters because the ENR table was measured against the original source reflection coefficient. Third, the internal attenuator pad that both sets the ENR level and improves output match drifts with thermal cycling.
None of these produce a visible symptom. The analyzer still passes its own self-alignment, the trace still looks clean, and the reported noise figure still lands in a plausible range. That is precisely the danger, the failure mode is a confidently reported wrong number rather than an obvious fault.
How much measurement error does a drifted ENR table cause?
That one-for-one transfer is worth spelling out, because it is often assumed that a small source error washes out somewhere in the measurement. It does not. The table below traces a realistic drift on a low-noise amplifier specified at 1.5 dB nominal with an 1.8 dB production limit.
| ENR table error | Reported NF | Test decision | Business consequence |
|---|---|---|---|
| ±0.00 dB (in tolerance) | 1.50 dB | Correct pass | Normal yield, defensible data |
| +0.10 dB | 1.60 dB | Pass | Acceptable; guard band absorbs it |
| +0.25 dB | 1.75 dB | Marginal pass | Guard band consumed; yield looks unstable |
| +0.40 dB | 1.90 dB | False reject | Good amplifiers scrapped or reworked |
| −0.40 dB | 1.10 dB | False accept | Out-of-spec parts shipped; escape and recall risk |
The negative-drift row is the one that should concern a quality manager most. A noise source reading low makes every product look better than it is, which produces no complaints internally and no yield alarm, until a customer’s incoming inspection disagrees with your certificate of conformance. Reconstructing which units were affected then becomes a reverse traceability and recall impact analysis exercise across every batch tested since the last valid calibration.
What dominates noise figure measurement uncertainty?
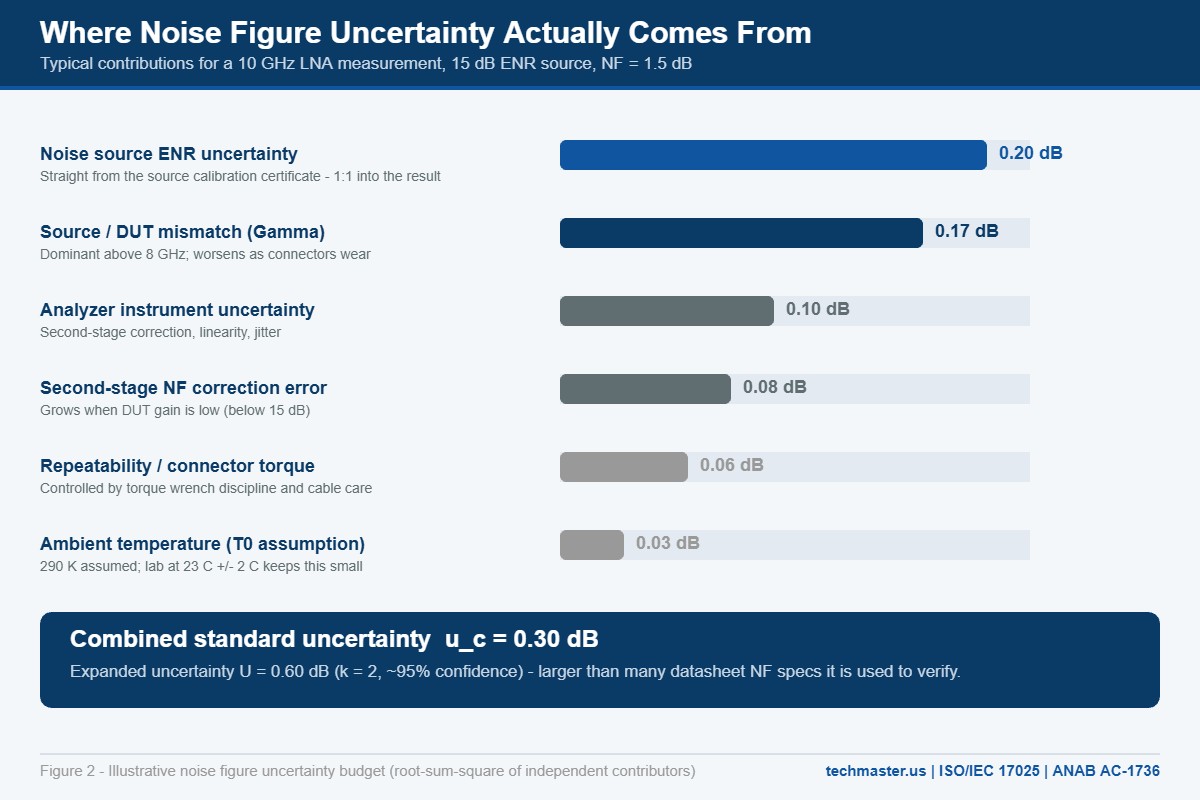
A representative budget for a 10 GHz low-noise amplifier measured with a 15 dB ENR source is shown below. The contributors are treated as independent and combined by root-sum-square, following the approach set out in building a measurement uncertainty budget under ISO/IEC 17025.
| Uncertainty contributor | Standard uncertainty | Share of variance | How you reduce it |
|---|---|---|---|
| Noise source ENR uncertainty | 0.20 dB | 45% | Accredited recalibration; tighter-uncertainty laboratory |
| Source-to-DUT mismatch | 0.17 dB | 32% | Attenuator or isolator; connector care |
| Analyzer instrument uncertainty | 0.10 dB | 11% | Analyzer calibration; verified attenuator paths |
| Second-stage NF correction error | 0.08 dB | 7% | Ensure adequate DUT gain, or add a preamplifier |
| Repeatability and connector torque | 0.06 dB | 4% | Torque wrench on every connection |
| Ambient temperature (T₀ assumption) | 0.03 dB | 1% | Stable lab environment at 23 °C ± 2 °C |
| Combined standard uncertainty uc | 0.30 dB | , | Root-sum-square of the six terms above |
| Expanded uncertainty U (k = 2) | 0.60 dB | , | Approximately 95% confidence |
Two conclusions follow. First, an expanded uncertainty of 0.60 dB is large relative to the 0.30 dB of guard band available on a 1.5 dB device with an 1.8 dB limit, meaning the measurement uncertainty exceeds the tolerance window it is being used to police. That situation demands an explicit decision rule and a documented guard band rather than simple pass/fail against the nominal limit; the reasoning is covered in test uncertainty ratio and decision rules in calibration.
Second, buying a more expensive analyzer will not fix it. The instrument term is 0.10 dB. Halving it moves the combined uncertainty from 0.30 dB to about 0.29 dB. Tightening the ENR uncertainty and controlling mismatch are where the real gains are, and both are calibration and technique problems rather than capital purchases.
How often should a noise source be recalibrated?
ISO/IEC 17025 does not prescribe intervals. It requires that intervals be justified and reviewed. The international reference for that justification is ILAC G24, Guidelines for the determination of recalibration intervals of measuring equipment, which sets out reliability-based methods for extending or shortening intervals using the artifact’s own calibration history.
| Usage profile | Frequency range | Starting interval | Primary risk driver |
|---|---|---|---|
| Production ATE, daily switching | Up to 18 GHz | 6 months | Diode cycling and connector wear |
| Production ATE, daily switching | 18–50 GHz | 6 months | Mismatch sensitivity rises sharply |
| Engineering bench, weekly use | Up to 18 GHz | 12 months | General ageing |
| Field service kit, transported | Any | 6–12 months | Mechanical shock and connector damage |
| Controlled reference, low use | Up to 18 GHz | 12–24 months | Extend only with documented drift history |
Interval decisions get easier once you have history to point at. Across Techmaster’s last ten years of accredited work, 381,916 calibrations covering equipment from 4,913 manufacturers, the pattern that recurs most often with RF artifacts is that usage intensity and connector handling, not elapsed calendar time, are what actually move an instrument out of tolerance. That is the argument ILAC G24 asks you to make with your own data.
Two events should override any calendar interval: a dropped or mechanically shocked source, and a connector that has been over-torqued or shows visible wear on the mating plane. Both change output match, and output match is baked into the ENR table.
What must an ISO/IEC 17025 noise source certificate show?
A certificate that reports only “calibrated, in tolerance” is not fit for purpose here, because you cannot load a pass/fail statement into an analyzer. You need numbers. Check for each of these before you accept the paperwork:
- ENR value at every frequency you use, not just the decade points. Interpolating across a sparse table adds error the certificate does not quantify.
- Per-frequency expanded uncertainty and coverage factor, ENR uncertainty typically worsens with frequency, so a single blanket figure hides your worst case.
- Output reflection coefficient, on and off, you cannot compute your own mismatch uncertainty without it, and mismatch is usually your second-largest term.
- Traceability statement, naming the national metrology institute or accredited chain the measurement is traced to.
- Accreditation mark and scope reference, the accreditation body, certificate number, and confirmation the parameter falls inside the laboratory’s scope.
- Decision rule, if a statement of conformity is given, ISO/IEC 17025:2017 requires the decision rule to be stated.
That last pair is where most laboratory selection goes wrong. Accreditation is parameter-specific, not company-wide: a laboratory can hold ISO/IEC 17025 accreditation and still perform your noise source calibration outside its accredited scope. Verify the scope directly in the ANAB directory of accredited organizations rather than relying on a logo. Techmaster’s own ISO/IEC 17025 accreditation scope under ANAB Cert. AC-1736 is published for exactly this reason, and reading a certificate line by line is covered in how to read an ISO/IEC 17025 calibration certificate.
How do you protect accuracy between calibrations?
Torque and gauge every RF connection
Connector wear is the fastest route to an invalid ENR table because it changes source match, and the ENR table was measured against the original match. A torque wrench set to the connector manufacturer’s specification, plus periodic pin-depth gauging, removes the dominant repeatability term at almost no cost.
Attack mismatch directly
Above roughly 8 GHz, mismatch uncertainty grows faster than any other contributor. A high-quality attenuator or isolator between the noise source and a poorly matched DUT reduces the reflection-coefficient product that drives the term. The trade is a small sensitivity loss for a substantially tighter uncertainty, usually a good trade when you are verifying tight noise figure specifications.
Run a golden-unit control chart
Keep one stable amplifier as an in-house check standard and measure it on a fixed schedule with a fixed setup. Plot the result. Drift in that chart is your earliest warning that the noise source has moved, and it converts an annual calendar decision into evidence-based interval management under ILAC G24. It also gives an auditor exactly the objective evidence they want to see.
Stagger, do not batch, your source calibrations
Laboratories with several noise sources often send them all out together. Staggering them keeps a recently calibrated source on site at all times, which lets you cross-check a returning unit against a known-good one and catch a shipping-damaged source before it contaminates production data.
Key takeaways
- Noise figure is computed as ENR minus 10 log(Y−1), so an ENR table error transfers into your reported noise figure one-for-one, with no dilution.
- A 0.4 dB ENR drift is enough to scrap good amplifiers or ship out-of-spec parts, and no analyzer self-test will flag it.
- ENR uncertainty plus source-to-DUT mismatch dominate the budget; a better analyzer barely moves the combined figure.
- Set intervals from drift evidence per ILAC G24, six months for high-duty production and above 18 GHz, 12 months for typical bench use.
- Demand a full per-frequency ENR table with uncertainties, reflection coefficient and decision rule, and verify the parameter is inside the laboratory’s accredited scope.
- Between calibrations, torque every connector, manage mismatch deliberately, and run a golden-unit control chart.
Frequently asked questions
Can I calibrate a noise source in-house against another noise source?
Does the noise figure analyzer also need calibration if the noise source is calibrated?
Why does my noise figure measurement get worse above 18 GHz?
What ENR value should I choose for a low noise figure device?
Is an out-of-tolerance noise source a reportable event under ISO/IEC 17025?
How long does noise source calibration take?
Need a traceable ENR table you can defend in an audit?
Techmaster Electronics has been calibrating RF and microwave test equipment since 1989, with ISO/IEC 17025 accreditation under ANAB Cert. AC-1736 across four accredited laboratories in Vista and Santa Clara, California; Orlando, Florida; and San Antonio, Texas. Explore our RF and microwave calibration services or the full calibration discipline coverage.
Request a Calibration Quote
Khanh Nguyen is the Marketing Manager at Techmaster Electronics, a B2B marketing leader covering the test, measurement, and ISO/IEC 17025 accredited calibration industry in the United States.